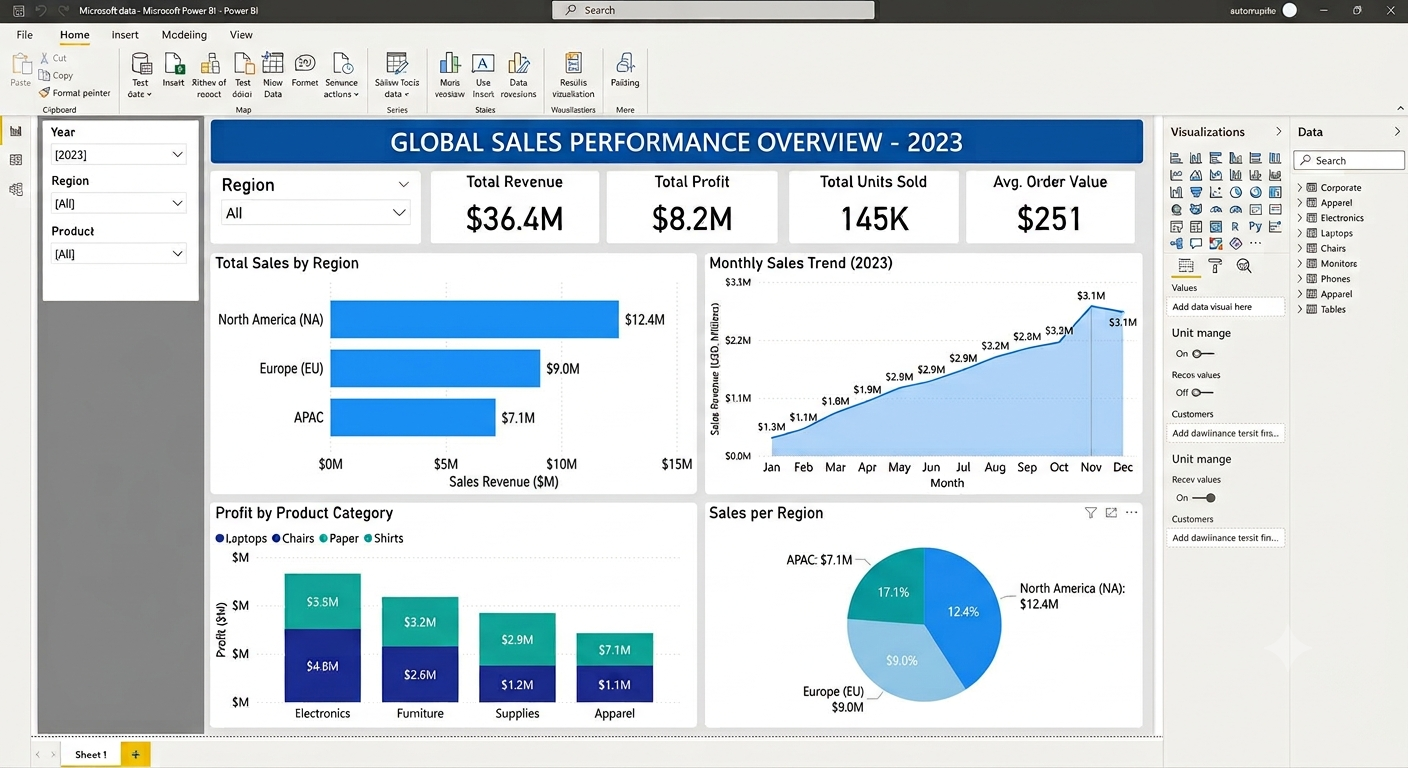
Designed and built an interactive Power BI dashboard to practice data visualization and dashboard development. Applied data preparation and modeling concepts to present business information clearly, working through Power Query transformations and DAX measures from scratch.
e.g. sql-ecommerce.png
Recommended: 1200×800px, PNG or JPG
Wrote SQL queries to analyze an ecommerce dataset — covering joins, aggregations, subqueries, and window functions to answer business questions like top-selling products, customer order patterns, and revenue trends. Focused on writing clean, efficient queries end to end.
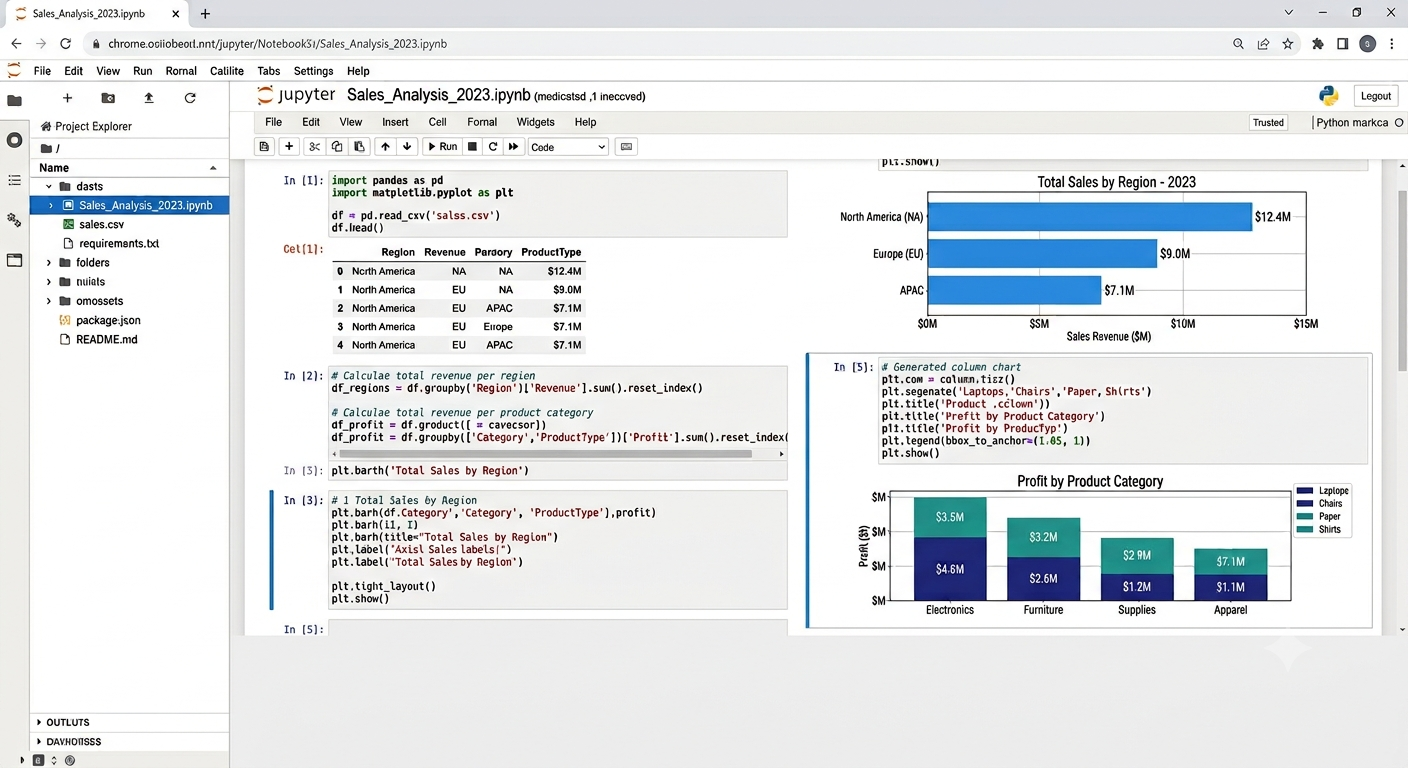
Used Pandas and NumPy to clean and process a structured dataset — handling missing values, formatting, and basic transformations — then used Matplotlib to visualize the results. Focused on applying core data analysis and basic modeling concepts end to end.